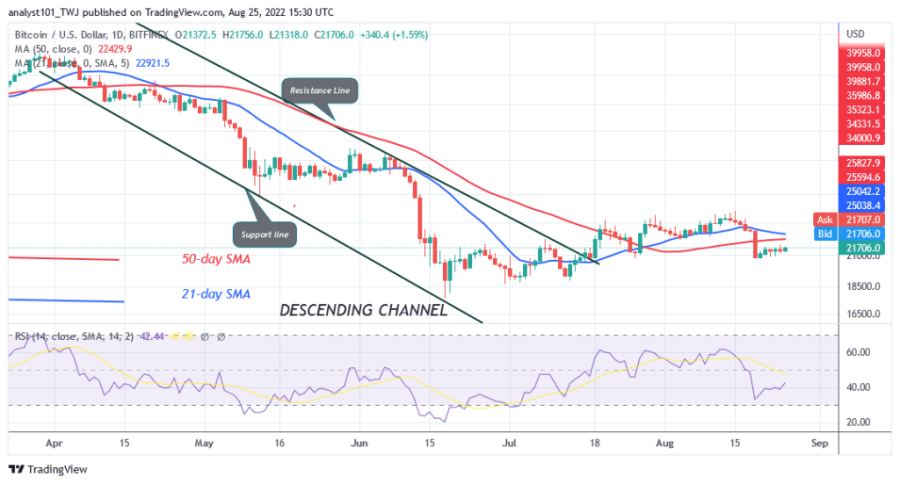
The price of Bitcoin (BTC) is in a downtrend as it holds above the support of 20,790 USD. Since August 19, the BTC price has been indecisive due to the presence of doji and gyro, small body candles. The price movement has been slow due to the indecision of buyers and sellers.

Buyers managed to stop the recent price decline but fail to regain bullish momentum as demand dries up at higher price levels. However, if the bears break the support at $20.790, the BTC price will continue to fall to $18.965. On the other hand, if the support at $20,790 holds and the BTC price achieves a recovery, Bitcoin will rise above the moving average lines. The bullish momentum will extend to the overriding resistance at $24,000 USD. Meanwhile, BTC/USD is trading at 21,738 USD at the time of writing.
Bitcoin Indicator Reading
Bitcoin is at level 42 of the Relative Strength Index for period 14. The cryptocurrency is in a downtrend despite the recent uptrend. The BTC price bars are below the moving average lines, which will lead to a decline. Nevertheless, the BTC price is below the 40% area of the daily stochastic. The market is in a bearish momentum. The 21-day SMA line and the 50-day SMA line are dipping south, indicating a downtrend.
- Advertisement -

Technical Indicator
Key resistance zones: $30,000, $35,000, $40,000.
Key support zones: $25,000, $20,000, $15,000
What is the next direction for BTC?
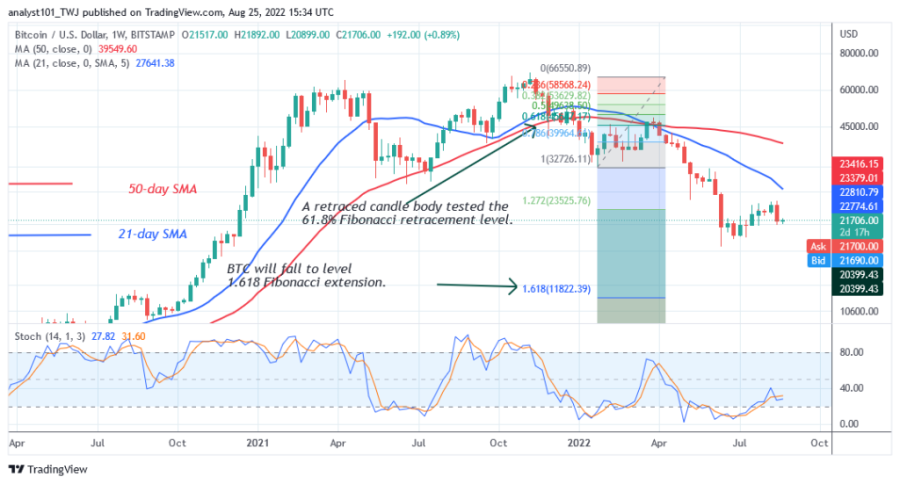
BTC/USD is moving above the support level of $20,790. Selling pressure will pick up again if the current support is broken. On the weekly chart, a candle tested the 78.6% Fibonacci retracement level on March 28. The retracement suggests that the BTC price will fall to the Fibonacci retracement level 1.272 or $11,822.39.
Bitcoin holds above $20,790 support as demand dries up at higher price levels


